Technology has changed the way citizens go about everyday activities. Ride-hailing apps especially have been a game-changer, enabling more convenient pick-ups and drop-offs at affordable rates.
Pulse Lab Jakarta in partnership with Grab, a ride-hailing, ride sharing, food delivery, and logistics services technology company, has been investigating how anonymized data generated from customers’ use of these services can be leveraged to improve efficiency in the transportation system. This blog looks at the analysis we’ve done so far to understand the dynamics of ride-hailing in Greater Jakarta and shares some other research in the pipeline.
Jakarta, 12 April 2019 — Ride-hailing apps have significantly transformed transportation in Indonesia, yet there is much research to be done on their potential to support national development goals. In Greater Jakarta for instance, not everyone uses public transport as some commuters prefer private transport for reasons of convenience. Having data-supported insights on segments that are underserved by both public and private transport services can, therefore, help city planners and policymakers develop an integrated transport system.
We started off by crunching anonymized driver’s GPS traces in Greater Jakarta during August 2018 to get an understanding about ride-hailing inflows/outflows at the sub-district level. To better communicate the results of the analysis, our team generated a set of interactive visualizations:
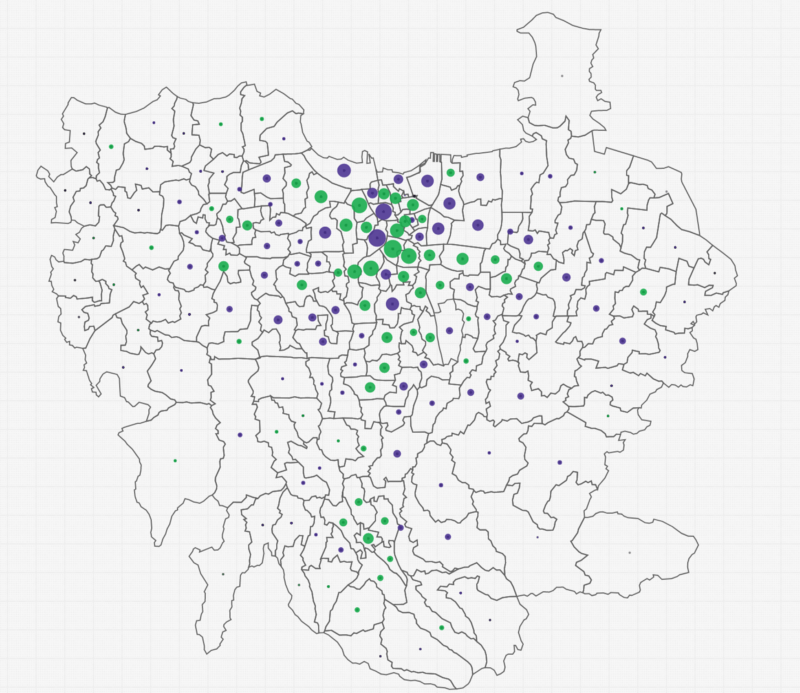
Traffic patterns in Greater Jakarta area
The visualization below shows traffic patterns in Greater Jakarta as inferred from Grab’s anonymized GPS data. A dot represents total traffic flow for a sub-district: the green dot indicates higher traffic flow into the destination (inflow) and the purple dot represents higher traffic flow going out of the destination (outflow) or equal inflow and outflow.
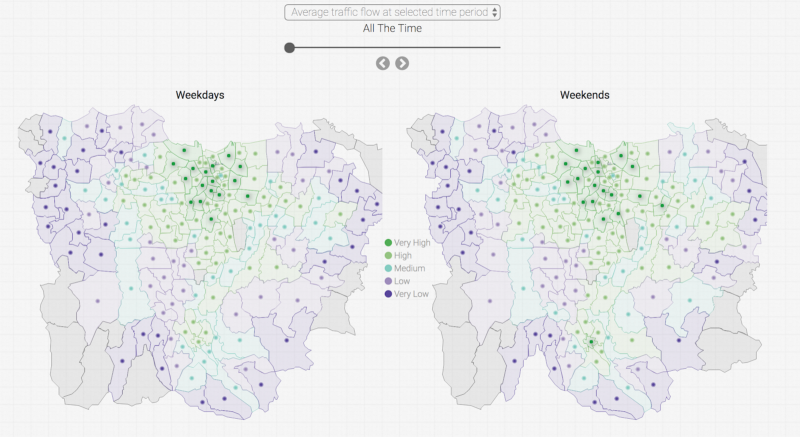
Differences in traffic flows during weekdays and weekends
The visualization below compares traffic flows during weekdays and weekends. We observed differences in traffic patterns in several sub-districts. For example sub-district Menteng, one of the busiest office and business areas in Jakarta, shows higher traffic during weekdays compared to weekends. An opposite trend is seen in commercial and tourist areas, like Bekasi Selatan and Bogor Tengah sub-districts. The color maps the intensity of traffic in a given sub-district. The purple color indicates lower traffic and gradually changes to green for higher traffic flows.
The 2018 Asian Games impact
When the Asian Games took place in Jakarta last year, we saw an opportunity to further explore these dynamics. With sports venues in Jakarta and Palembang, the Games attracted more than 80,000 foreign visitors. To investigate the impact to the services offered by Grab, we established an index based on a timeline before (March-July 2018) and during (18 August to 2 September) the event. Grab had created more than 100 customized points of interest (POIs) to ensure the smooth pick up and drop off of passengers and goods at Asian Games venues in Jakarta and Palembang. We examined the flows to and from these POIs, as well as associated revenues for drivers operating in Jakarta, Bogor, Depok, Tangerang, and Bekasi (Jabodetabek) area and Palembang. Here’s what we found interesting:
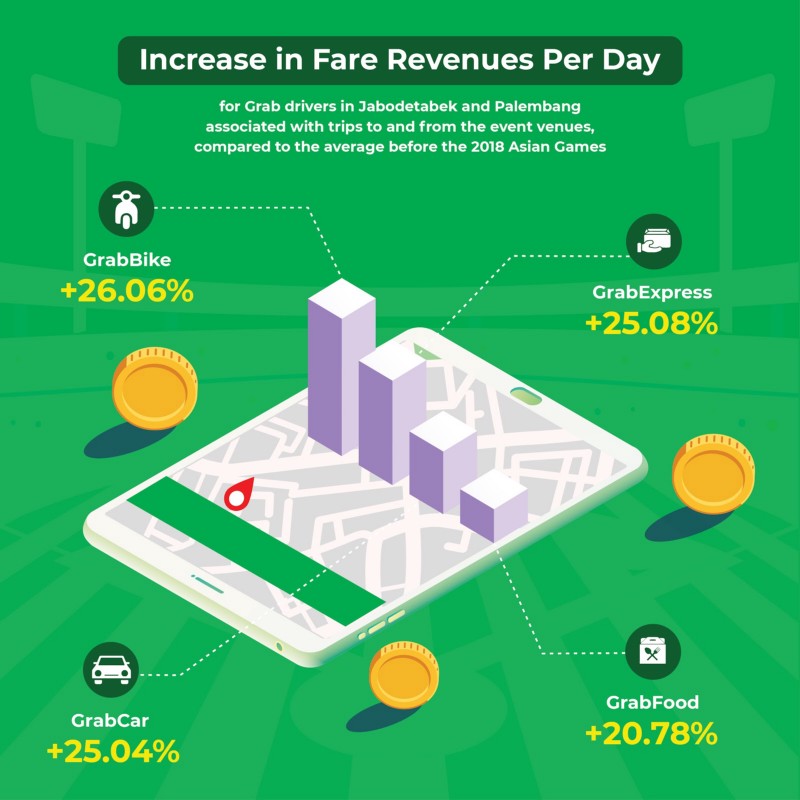
During the Games, driver partners operating in Jabodetabek and Palembang received an average increase of 24% in daily fare revenue. For specific services, GrabBike driver partners had the highest average increase in daily revenue (26%); followed by GrabCar and GrabExpress driver partners both with an average increase of 25% in daily fare revenue; then GrabFood driver partners saw an average increase of around 21%.
Research in the pipeline
Pulse Lab Jakarta (PLJ) is pleased to be partnering with Grab and continues to explore ways to leverage new streams of data to inform public policy and sustainable development. Going forward, PLJ will act as Regional Data Partner for Grab-UN research partnerships, and we are happy to be the data analytics partner within the UN system. The Asian Games provided a unique opportunity to analyze data on Grab’s services with a view to promoting economic growth and resilience at the subnational and national levels. Our ambition is to further collaborate with other partners to investigate areas of urban dynamics through the use of data from ride-hailing services, for instance to:
1. Infer information about road conditions using data from drivers’ motion and location sensors. This has the potential for greater impact since the approach can be replicated in other Indonesian cities, as well as in cities across Southeast Asia where Grab is operational.
2. Investigate trips from public transport stations and pickup/dropoff points to examine how they vary according to weather conditions, traffic congestion, time, day of the week and modes of transportation. This is an essential component for understanding the first and last mile needs of users, which can provide insights to improve public-private transport integration.
We have used open source data features in developing the visualization, again this makes it easy for the approaches to be replicated in other cities. Our research team will be diving into these research projects in the coming months and we’re open to other suggestions. Do you have ideas of how we can leverage transportation data to address a challenge in your city? Get in touch with us!
This piece first appeared on Pulse Lab Jakarta’s blog. It has been edited according to KrASIA’s style guide.